
Operations optimization
Data unification & operations optimization
Industrial cameras combined with computer vision models, automatically detecting defects on the production line — working alongside human inspectors.
THE PROBLEM
Scattered data, hard to make fast decisions
The journey of a number from the production line to the decision table — 5 sources, no connection
ERP · Warehouse · Production
Manual extraction
~1 day
Reconciling discrepancies
~1 day
Compiling consolidated report
~1 day
Compiling consolidated report
~1 day
Already late
Cumulative delay: reports reach leadership when the situation on the line has already changed
Decisions based on outdated data
Or decisions based on experience, without data-backed evidence
Risks discovered too late
Material shortages, cost overruns, schedule delays only surface after they've occurred
Numbers don't match across departments
Extra time spent reconciling before each reporting period



SOLUTION
From scattered data to a unified data foundation

Scattered sources
ERP · MES · WMS

Excel · forms


Unification & linking
Connected by real business relationships

Centralized data foundation
Orders · materials · progress · costs


Alerts

AI assistant

Monitoring and alert layer
Automatically monitors critical operational metrics and triggers early alerts when anomalies appear — before problems become incidents.
Analytics assistant layer
Business users ask in natural language and get answers from real data — no queries needed, no waiting for IT.
Cloud
Fastest deployment, prioritizing speed to operation
Real-time holistic view
Risks surfaced early, before costs are incurred
Dramatically reduce manual report compilation
Unified numbers across departments

Live demo
Product in production — demo for the textile industry
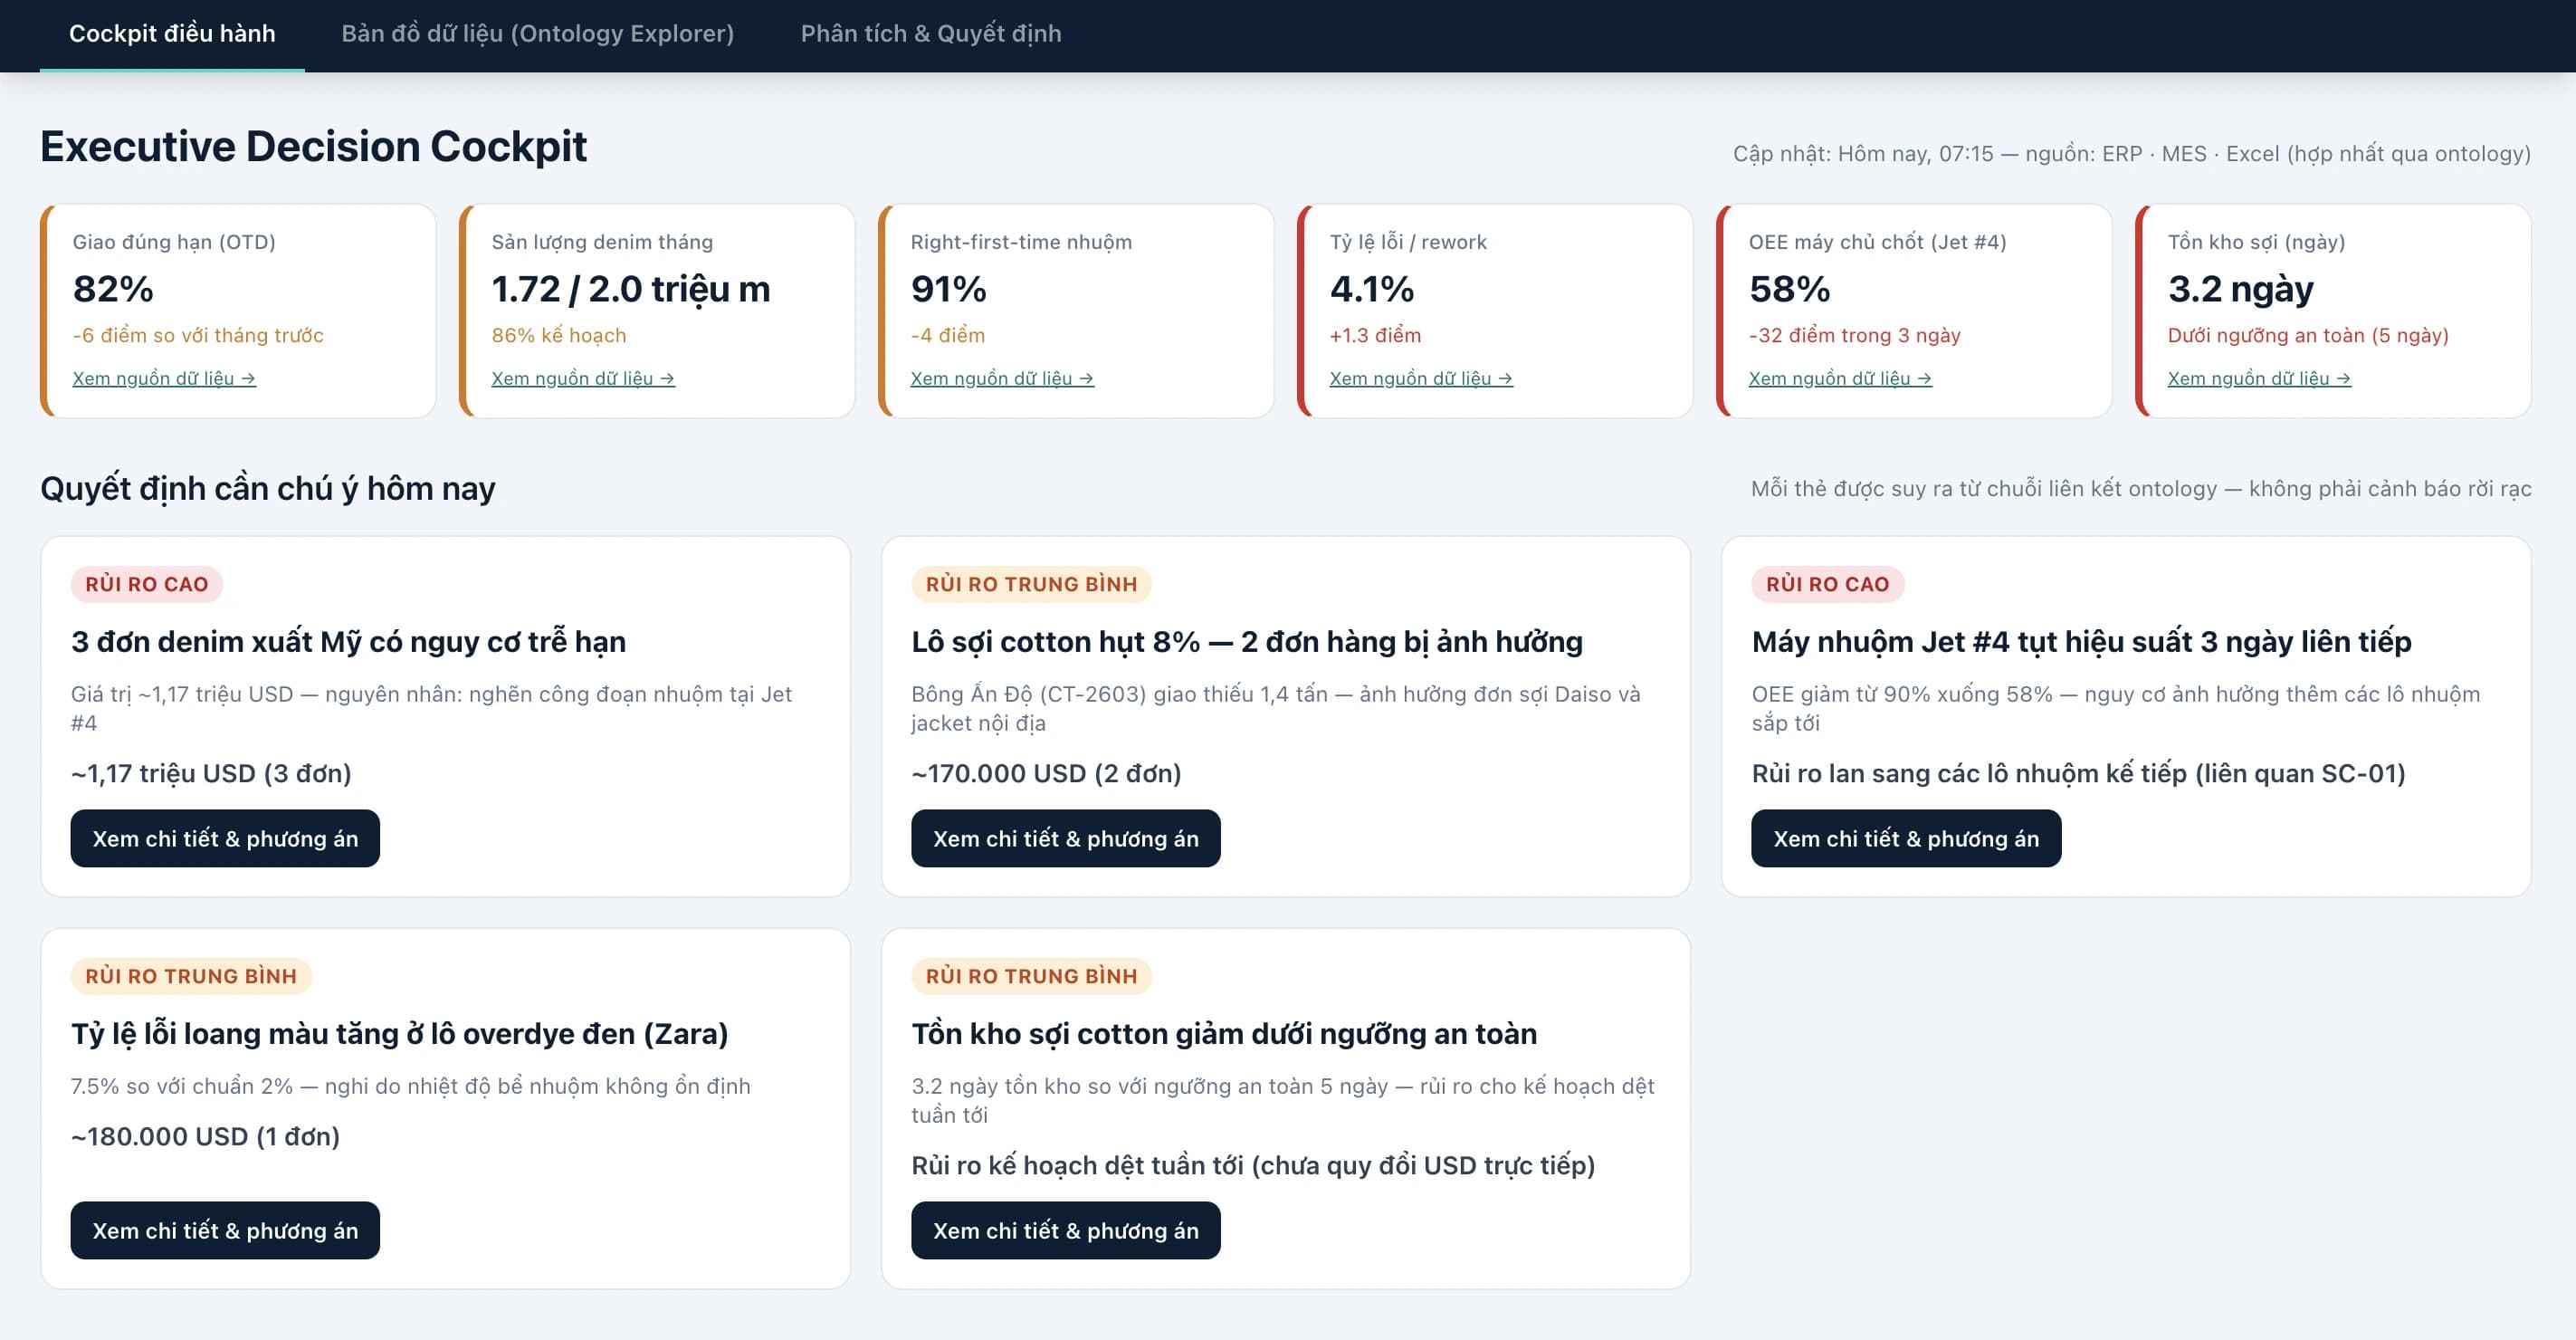
The three screens below are a real system, running on simulated data from a textile factory, unifying data from ERP, MES, Excel, and even Zalo messages from suppliers.

Live data map
Client → orders → cotton/fiber → yarn → greige fabric → dyeing. Each object shows its source: ERP, MES, Excel, or Zalo.
Operations cockpit
Critical operational metrics plus a list of risks needing attention today, with monetary value attached to each risk.
Root cause tracing
From a risk, the system traces back to the chain of causes and explains what data supports each conclusion.
Featured project
Garment factory specializing in premium exports
Context
A garment manufacturer producing premium export goods, operating multiple factories. Production and inventory data resided in separate, disconnected systems.
Results
Reporting cycle reduced from days to same-day. Automated alerts detect material shortages early. Factory data standardized on a single data foundation.
Solution
End-to-end data unification from sales to production. Real-time analytics assistant for productivity, quality, and progress across all factories.
Deployment scope
Multiple factories, one data foundation.
Figures are target expectations, not achieved results. Specific targets are agreed in writing after the assessment phase.
Report consolidation time (hours)

72 h
Before deployment
4 h
Target after deployment
Reporting cycle: days → same day
Ready to assess your enterprise operations?
All information exchanges are conducted under NDA.